Crystal Reports for Acumatica — Help Center
Working with Datasets and Table Relationships in AstraReports
The power of AstraReports lies in its ability to pull data from multiple tables in Acumatica and present it cohesively. Understanding how datasets work and how to configure relationships between tables is central to building reports that accurately reflect your business data. Whether you’re combining purchase order headers with line items or matching customer records with transaction history, mastering datasets and relationships will make you confident in any report design.
What Are Datasets in AstraReports?
A dataset is essentially your report’s data source—the collection of fields and records that will populate your final report. In AstraReports, datasets are built from two primary sources: Generic Inquiries (pre-configured data views in Acumatica) or PX Objects (direct references to Acumatica’s database tables). Most reports start with a single primary dataset, though complex reports may combine multiple related datasets to tell a complete story.
Generic Inquiries are Acumatica’s built-in, optimized views of data. They’re user-friendly because Acumatica has already structured them logically and included only the fields most people need. PX Objects, by contrast, are direct table references. They give you granular control and access to every field in a table, but they require more knowledge of Acumatica’s database structure. For most controllers and finance managers, starting with a Generic Inquiry is the practical choice.
Adding Tables to Your Report
When you create a new report in AstraReports, you begin by selecting your primary table or Generic Inquiry. This is the “main” data source for your report. Let’s say you’re building a purchase order report. You’d select the PO.POOrder table, which contains order-level information like order number, vendor, order date, and total amount.
[Image: Table configuration screen with PX Objects like PO.POOrder and PO.POLine]
From there, you can add additional tables if your report needs line-item detail. For our purchase order example, you’d add PO.POLine, which contains information about each line in the order. Now your report has access to both header-level data (the order as a whole) and line-level data (each product or service ordered). Without properly configuring the relationship between these tables, however, Acumatica won’t know how to match lines to their parent orders—that’s where links come in.
Understanding the DATASET Tab
The DATASET tab in AstraReports displays all the tables you’ve selected for your report. Each table appears as a separate entry, showing the table name, any alias you’ve given it, and the fields it contains. This tab is your reference guide: it shows you exactly what data is available for your report design.
When working in the DATASET tab, you’ll often see fields grouped by their source table. In our purchase order example, fields like “OrderNumber” and “OrderDate” come from PO.POOrder, while “LineNbr” and “Description” come from PO.POLine. Keeping this organization in mind helps you build logical reports where data is grouped and presented clearly.
Configuring Links Between Tables
The LINKS tab is where you define how tables relate to each other. This is critical: without proper links, your report will produce cartesian products—a dangerous multiplication of records where every row in one table is matched with every row in another. A purchase order with three line items, linked incorrectly, could explode into dozens of nonsensical rows.
[Image: Links tab showing join configuration with Inner Join and Left Join options]
To create a link, you specify a linking field from each table. In the purchase order scenario, both PO.POOrder and PO.POLine contain an OrderNumber field (or OrderNbr in Acumatica’s terminology). You drag from OrderNumber in the header table to OrderNumber in the line table, and AstraReports automatically recognizes this as the join condition.
You must also specify the join type. An Inner Join returns only records where a match exists in both tables. If you use an inner join with purchase orders and line items, your report will include only orders that have at least one line. An Left Join returns all records from the primary (left) table, plus any matching records from the secondary (right) table. With a left join, your report would include all orders, even those with no lines—which is usually what you want for a complete order summary.
For our purchase order example, you’d typically use an inner join because you’re interested in orders that have lines. But if you were linking orders with optional shipment information, a left join would ensure you don’t accidentally drop orders that haven’t shipped yet.
The PARAMETERS Tab
While not strictly about table relationships, the PARAMETERS tab works hand-in-hand with your datasets. Parameters let users filter your report at runtime—selecting a date range, vendor, or order status before the report generates. When you define a parameter, you tell AstraReports which field it should filter. For example, a “Vendor” parameter would typically filter against the Vendor field in your PO.POOrder table.
[Image: Field mapping display showing how tables connect through shared fields]
Managing Multiple Links
As reports grow in complexity, you may need to link three, four, or even more tables. AstraReports handles this by chaining links together. You might link PO.POOrder to PO.POLine (via OrderNumber), then link PO.POLine to IN.InventoryItem (via InventoryID) if you need product descriptions and inventory class information.
When managing multiple links, clarity is essential. AstraReports lets you see all your links visually in the LINKS tab, with each link showing the field pairs and join type. Review this tab carefully—a single incorrect link can cascade into problems throughout your report.
Deleting and Modifying Links
Links aren’t permanent. If you realize you’ve linked the wrong tables or changed your report’s purpose, you can delete a link and create a new one. Simply select the link you want to remove and click Delete. Be aware that removing a link may invalidate calculations or groupings that depend on it, so preview your report after any significant changes.
Similarly, if you need to change a join type from inner to left (or vice versa), you can edit the link properties. This is a common adjustment as you refine your report during testing.
Best Practices for Dataset Configuration
Start with a clear picture of what your report should show. Before you open AstraReports, sketch out which tables you need and how they relate. Do you need order headers with lines? Customer summaries with transactions? This clarity makes the dataset configuration process much faster.
Use meaningful table aliases if you’re linking the same table multiple times (e.g., linking to AR.Customer both for “Bill To” and “Ship To” information). An alias helps you and other users understand the purpose of each instance.
Test your dataset structure before you invest time in beautiful formatting. Run the report with sample data to confirm that your links are working correctly and that the record counts make sense. If you’re expecting 100 orders and get 150 rows of output, your links probably need adjustment.
Practical Example: The Complete Purchase Order Report
Let’s walk through a complete example. You create a new report and select PO.POOrder as your primary table. You add PO.POLine as a secondary table, linking them on OrderType and OrderNbr (both tables contain these fields, which uniquely identify each order). You use an inner join because you want only orders with at least one line.
Next, you add a parameter for OrderNumber so users can filter to specific orders. You configure the parameter to display a list of available order numbers drawn from your dataset. In the report designer, you place the order header information (vendor, order date, total) once at the top, then create a detail section that repeats for each line item. The result is a clean purchase order report that anyone in your finance team can run.
Saving and Validating Changes
After you’ve configured your dataset and links, save your changes. AstraReports validates that all your field references are correct and that your join conditions make sense. If there are problems—a link references a field that doesn’t exist, for example—you’ll receive an error message. Address these before downloading your .RPT template for design work.
Properly configured datasets and relationships are the foundation of reliable, accurate reports. Once you master this aspect of AstraReports, you’ll be able to tackle reporting requests with confidence, knowing that your data is correctly structured and your joins are sound.
Step-by-Step: The AstraReports Entity Relationship Diagram
Behind the scenes, AstraReports stitches Acumatica data together using a handful of well-defined entities. The ERD below maps how those entities relate—it is the same diagram the Pixis engineering team uses when troubleshooting integration questions, and it is worth bookmarking before you start building complex datasets.
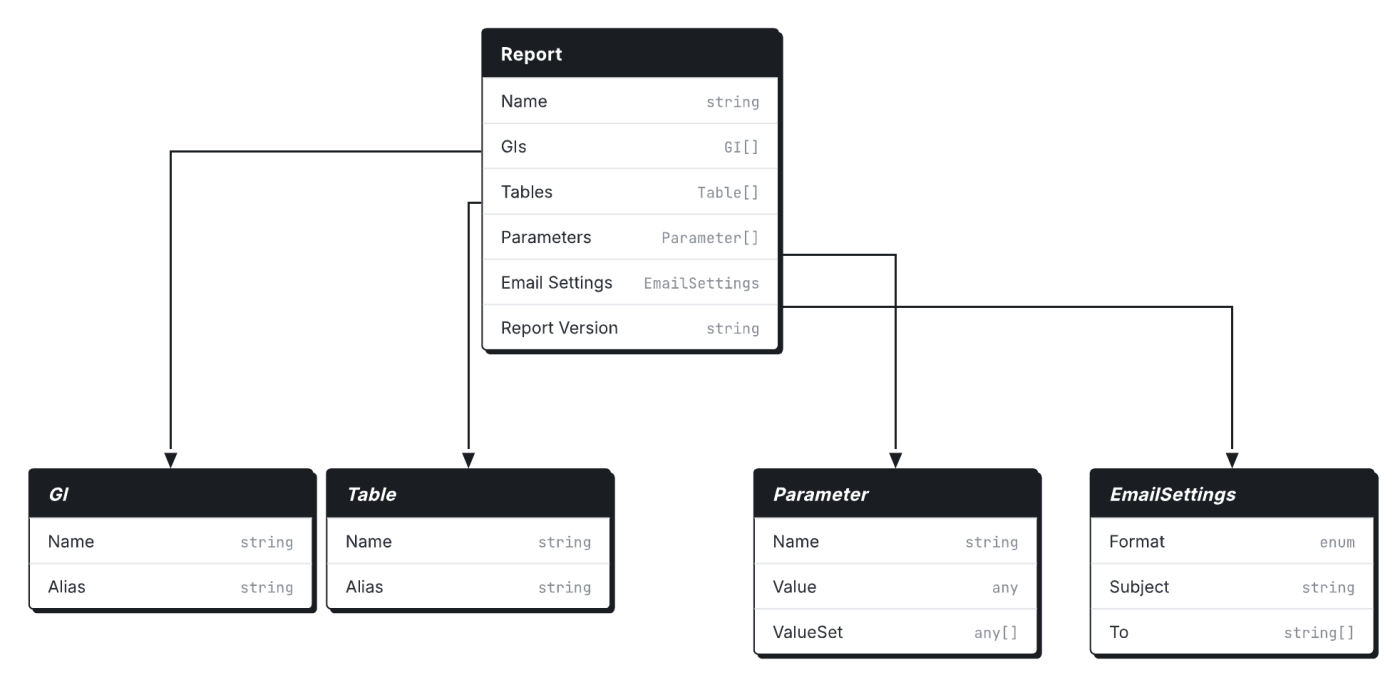
A few practical takeaways once you have the ERD in front of you:
- Generic Inquiries are the preferred entry point for new reports because they encapsulate the joins and filters Acumatica already supports. Reach for raw PX Objects only when a Generic Inquiry cannot give you the fields you need.
- Crystal Reports objects (the .rpt artifacts) are versioned. A single report can have many versions, but only one active version is rendered when a user clicks Preview Report.
- Email Templates and Schedules attach to a Crystal Report rather than to a specific version. That means promoting a new version does not break automated distribution—the schedule keeps pointing at whichever version is currently active.
Use this ERD as a reference when you are deciding whether to add a new field to an existing Generic Inquiry or whether the report deserves its own data source. The diagram makes the trade-offs visible at a glance.