Crystal Reports for Acumatica — Help Center
Navigating the AstraReports Interface: A Visual Tour
Navigating the AstraReports Interface: A Visual Tour
Once AstraReports is installed in your Acumatica environment, you’ll notice new functionality integrated throughout the system. Rather than appearing as a separate, disconnected application, AstraReports feels native to Acumatica. This integration means you’ll find reporting tools embedded in the screens and menus you already use daily. Understanding where everything lives will accelerate your ability to build, manage, and access reports.
The Main Interface Areas
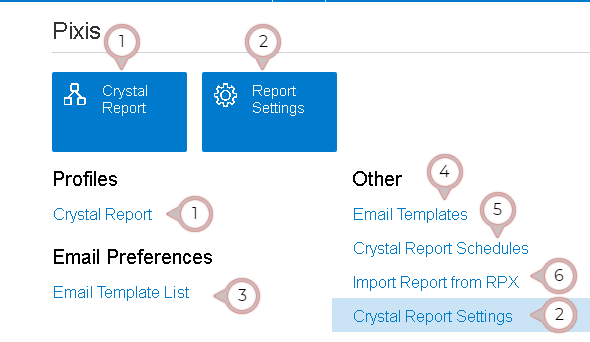
The primary entry point to AstraReports is through the Crystal Report Tab, which appears in the main workspace of Acumatica. When you’re in any accounting module—General Ledger, Accounts Receivable, Accounts Payable, or others—you’ll see a tab labeled “Crystal Report” alongside the standard tabs like “Summary,” “Details,” or “Document.” Clicking this tab opens the Crystal Reports design workspace, where you can create new reports or edit existing ones.
The Crystal Report Tab is where the actual design work happens. Here you’ll find the full SAP Crystal Reports interface embedded within Acumatica. You can add data sources, design report layouts, configure formulas and calculations, set up charting and crosstabs, and define the visual presentation of your data. If you’re familiar with Crystal Reports from previous ERP systems, this workspace will feel immediately comfortable.
Alongside the Crystal Report Tab, you’ll find the Report Settings Tab. This is where you configure report-specific properties: the title, description, permissions, email delivery settings, and other metadata that controls how the report behaves within your system. The Report Settings Tab is accessible for any report you’ve saved, allowing you to fine-tune its properties without re-entering the design workspace.
Administration and Configuration Areas
Beyond the main workspace, AstraReports integrates with Acumatica’s administration and customization sections. Navigate to Administration to find several key areas:
The Profiles > Crystal Report section allows you to create and manage report profiles. Profiles are essentially saved report configurations that you can apply to multiple reports, standardizing settings like fonts, formatting, margins, and default behaviors across your organization’s reporting library.
The Email Preferences > Email Template List section contains templates for report delivery notifications. When you configure a report to send via email, these templates define the email subject line, body text, and formatting. Customize these templates to include your company branding and specific messaging that aligns with your reporting standards.
Under the Other menu category, you’ll find several additional reporting tools:
Email Templates allows you to create and manage custom email message templates used during report scheduling and distribution. If you want your scheduled reports to arrive with a specific subject line or personalized message, configure them here.
Schedules is where you view all active report schedules in your system. This section shows you which reports are configured to run automatically, when they run, and the status of recent executions. If a scheduled report fails, the Schedules section will display an error notification, allowing you to investigate and correct the issue.
Import Report from RPX provides functionality to import reports from RPX files (Crystal Reports’ native file format). If you have existing Crystal Reports developed outside of Acumatica, you can import them here and integrate them into your AstraReports library.
Crystal Report Settings is the system-wide configuration area for AstraReports. Here you set the Report Server address, credentials, timeout values, and admin access rights as described in the installation and configuration guide.
The Reporting Section
Acumatica also includes a dedicated Reporting section in the main module list. This is a hub where finance users and report consumers can access reports without navigating through administrative menus. From the Reporting section, you’ll see a list of all reports available to you based on your permissions. You can search for reports by name, view descriptions, and launch reports directly.
The Reporting section is designed for consumption and execution, not design. It’s where finance managers, controllers, and other stakeholders go to run reports, view schedules, and download outputs. Power users might also use this section to trigger a report run on demand before it’s scheduled to run automatically.
Quick Navigation Tips
Most Acumatica layouts include quick links or shortcuts to frequently used reporting functions. Depending on your organization’s configuration, you may see a “Reports” widget on your Acumatica home dashboard that displays your most-accessed reports or shows recent report activity. These shortcuts reduce navigation time and make reporting more accessible to casual users.
When building reports, remember that the Crystal Report Tab is context-sensitive. If you’re designing a General Ledger report, you’re working within the GL module’s context, and the data sources available to you are appropriate for GL data. If you need to design a cross-module report that pulls from multiple areas of Acumatica, you can usually define those data sources through Crystal Reports’ query builder without leaving the design workspace.
Finding Your Way
The most important principle to remember is that AstraReports is designed to feel integrated into Acumatica rather than bolted on. You won’t find a separate “AstraReports” menu or launcher. Instead, reporting functionality is woven throughout the system. The Crystal Report Tab is your main design workspace, Report Settings Tab is for configuration, and the Reporting section is where you and your colleagues consume reports.
As you become more familiar with AstraReports, you’ll develop muscle memory for where to find specific functions. Report developers will spend most of their time in the Crystal Report Tab and Report Settings screens. Finance managers and controllers will primarily use the Reporting section to access and run reports. Administrators will configure system-wide settings in the Crystal Report Settings area.
Next Steps
Now that you understand the layout and key interface areas, you’re ready to dive into building your first report or managing existing templates. Start by exploring the Reporting section to see what reports are already available in your environment, then gradually move toward designing custom reports that address your organization’s specific needs.
Remember that Pixis Software provides documentation, templates, and support resources to help you master the interface and become proficient with report design. Don’t hesitate to consult those resources as you explore AstraReports functionality.
Step-by-Step: A Guided Tour of the Pixis Extension Interface
When you open the Pixis Extension inside Acumatica, you land on a workspace organised into six clearly labelled tabs. Each tab maps to one job-to-be-done in the report lifecycle, so once you know which tab does what, navigating AstraReports becomes second nature.
Here is what each tab is for and when you will reach for it:
- Crystal Report — Where you create new reports and preview existing ones. This is the day-to-day workspace for report designers.
- Report Settings — Where the Report Server connection, credentials, and access rights are configured. Administrators live here during setup; everyone else rarely needs to touch it.
- Email Preferences — Where you set up the rules for sending reports to recipients on a scheduled basis (SMTP, default sender, retry behaviour).
- Email Templates — Where reusable email bodies are written so that recurring reports always go out with consistent branding and language.
- Schedules — A consolidated list of every email template tied to a Crystal Report run, with its cadence and recipients.
- Import Report from RPX — A bridge that imports existing Acumatica Report Designer reports (.rpx) into Crystal Report format with a single click.
How the Tabs Connect
The six tabs are not just a flat menu—they are arranged in the order most teams use them during a real implementation. You start in Report Settings to point the extension at your Report Server, then move to Crystal Report to create or import a report, then layer on Email Templates and Schedules when you are ready to automate distribution. New users often miss this flow because they jump straight into Crystal Report; spending five minutes in Report Settings first prevents most “why isn’t this
Where Power BI Fits in the Interface
With the addition of the Power BI engine, two areas of the AstraReports interface are worth knowing. First, Report Settings now includes a Power BI tab, where you store the connection to your Microsoft tenant (Tenant ID, Client ID, and Client Secret). Second, the Astra Report Design screen includes a Report Engine selector that lets you choose Crystal Report or Power BI for each report, along with a Power BI tab for creating the dataset and selecting the published report. Everything else in the workspace — Generic Inquiry data sources, access rights, and preview — works the same regardless of which engine you pick. For setup details, see “Setting Up Power BI Integration with Acumatica.”