Crystal Reports for Acumatica — Help Center
Optimizing Report Performance for Large Acumatica Datasets
Optimizing Report Performance for Large Acumatica Datasets
As your Acumatica deployment grows and transaction volumes increase, report generation can slow noticeably. A report that runs in seconds against a month of data might take minutes or longer when processing a full year of transactions. The good news is that most performance issues stem from data retrieval inefficiency rather than AstraReports limitations. By applying strategic optimizations at the query and design levels, you can maintain fast report performance even as your dataset scales.
Why Large Datasets Cause Performance Issues
Understanding the root cause of slow reports helps you target the right optimization strategy.
The Generic Inquiry bottleneck: AstraReports retrieves data through Acumatica’s Generic Inquiries, which query your Acumatica data through the Web API. If your Generic Inquiry is poorly designed, it will pull excessive data into memory before the report even begins processing. A Generic Inquiry that retrieves all transactions from the past decade, all customer records, and all product information—when your report only needs current-month sales—wastes database queries, network bandwidth, and server memory.
Complex joins and multiple tables: Generic Inquiries that combine data from many tables create computational overhead. Each join operation requires the database to match records between tables, and complex joins with subqueries can overwhelm the API layer.
No filtering at the query level: When your Generic Inquiry pulls all available records and then relies on the report to filter them down, you’re processing far more data than necessary. A report showing only completed transactions should filter at the Generic Inquiry level, not retrieve all transactions and let the report discard the unwanted ones.
Acumatica Web API limits: The Acumatica Web API has inherent throughput limitations. Large queries can hit rate limits or timeouts. Additionally, you’re competing with other Acumatica users and processes for API resources, so query efficiency directly affects report responsiveness.
The fix is rarely “wait longer”—it’s almost always “retrieve less data.”
Optimization Strategy 1: Use Parameters to Filter Data Before Load
This is the single most impactful optimization you can implement. Parameters allow users to specify exactly which data subset they want to retrieve, dramatically reducing the volume of data entering the report engine.
How parameters work: When you add a parameter to a report—such as a date range, cost center, or customer—that parameter filters the Generic Inquiry before data loads. Instead of pulling all transactions and filtering afterward, the Generic Inquiry queries for only transactions matching the specified criteria.
Implementing parameters:
- Identify the fields that would naturally limit your dataset: date ranges, company ID, department, product category, or status
- In your Generic Inquiry, add a WHERE clause (or equivalent filter) that references a parameter value
- In AstraReports, define the parameter with a default value and optional list of allowed values
- The parameter appears as a user-facing filter when the report runs
Example: An Accounts Payable report that could theoretically span years of invoices takes minutes to generate because it pulls all invoices, then filters to display them. By adding a “From Date” and “To Date” parameter, users select the date range they want before running the report. The Generic Inquiry retrieves only invoices matching that date range. Report generation time drops from minutes to seconds.
Parameters are the fastest path to performance improvement because they reduce data volume at the source.
Optimization Strategy 2: Optimize Generic Inquiry Design
A well-designed Generic Inquiry is the foundation of report performance.
Select only the fields you need: Review the Generic Inquiry feeding your report and delete any fields the report doesn’t display or use. If the report shows customer name, invoice number, and amount, but the Generic Inquiry retrieves customer address, phone number, and payment terms, you’re wasting resources. Fewer fields means faster data retrieval.
Minimize joins: Every join operation adds computational cost. If you can achieve the same result with fewer joins, do so. For example, if you’re joining to a lookup table just to get a description that could be retrieved in another step, consider whether the join is truly necessary.
Evaluate join types: Inner joins filter out non-matching records automatically, while left joins include all records from the left table regardless of matches. For performance, inner joins are typically faster because they reduce the result set earlier. Use left joins only when you specifically need to preserve unmatched records.
Avoid subqueries when possible: A Generic Inquiry with nested subqueries is substantially slower than equivalent logic structured as joins or simple WHERE clauses. If you’re using subqueries for convenience during report design, refactor them once you move to production.
Review WHERE clause logic: Complex WHERE clauses with many OR conditions can be slow. If you’re filtering for “transactions in departments A or B or C or D or E,” consider whether a parameter accepting a department range would work instead.
Optimization Strategy 3: Use Row Count to Limit Test Data
When you’re downloading an RPT template to use in AstraReports, you’re initially testing against a sample of data. AstraReports provides a Row Count setting that limits how many rows are included in your test dataset.
Using a small row count—such as 100 or 500 rows—during development allows you to design and iterate quickly. Once your report is functionally complete, you can increase the row count to test performance against a larger sample, then to the full production dataset.
This prevents the scenario where a report looks fine during development but crawls when run against the full data volume. Test performance incrementally as you increase row count, and adjust query optimization if performance degrades beyond acceptable limits.
Optimization Strategy 4: Leverage Load Data to Dataset Strategically
The “Load data to Dataset” checkbox controls when data actually flows from Acumatica into your report. In most cases, this should be enabled—it ensures data loads efficiently. However, understand what this setting does:
- Enabled: Data loads from Acumatica into the report dataset in the most efficient manner possible
- Disabled: Data flows differently, and in some cases can reduce performance
Leave this enabled unless you have a specific reason to disable it for particular datasets. Work with Pixis Software support if you’re considering disabling it for performance reasons—there may be a better optimization path.
Optimization Strategy 5: Understand Table Relationship Performance
In your report’s Dataset configuration, you define relationships between tables. The type of relationship affects performance.
Inner Join: Retrieves records that exist in both tables. Faster than left join because it reduces the result set. Use this when you want only complete records with matches in both tables.
Left Join: Retrieves all records from the left table, with matching records from the right table (nulls if no match). Slower than inner join because it maintains all left table records regardless of matches. Use this when you specifically need unmatched records from the left table.
For performance, prefer inner joins when your business logic permits. If you’re building a report showing only invoices with matching payment records, an inner join is both faster and logically correct.
Optimization Strategy 6: Adjust Request Timeout for Legitimate Large Reports
Some reports legitimately need to process large volumes of data—annual financial statements, multi-year trend analysis, or subsidiary consolidations. For these reports, increasing the Request Timeout is appropriate.
In AstraReports Settings, adjust the Request Timeout value upward. This tells the system to wait longer before abandoning a report request. A timeout of 120 seconds or higher works well for complex reports that require substantial processing time.
However, always combine timeout adjustment with the other optimization strategies. A timeout of 300 seconds doesn’t help if your query is fundamentally inefficient. Optimize first, then increase timeout only for reports that are inherently complex and slow despite optimization.
Optimization Strategy 7: Server-Side: Leverage Acumatica Processing Nodes
At the infrastructure level, Acumatica supports Processing Nodes—dedicated servers that handle intensive background processing and report generation. If your organization is experiencing consistent performance issues with report generation, dedicating a Processing Node to report workloads can alleviate bottlenecks.
Processing Nodes handle Web API calls and background processing independently from your main Acumatica server, preventing report generation from impacting regular business processing. This is a deployment-level optimization rather than report-level, but it’s worth considering if individual report optimization doesn’t fully resolve performance issues.
Work with your Acumatica administrator or systems integrator to evaluate Processing Node benefits for your specific environment.
Optimization Strategy 8: Report Design Best Practices
How you design the report itself affects performance.
Avoid subreport overuse: Subreports execute independently and can multiply the number of queries your report makes. A report with 50 rows and 3 subreports might execute 150+ queries. Use subreports only when necessary, and consider whether grouping in the main report could achieve the same result.
Use grouping instead of multiple queries: If you need to show data aggregated by department, use Crystal Reports’ grouping feature rather than creating separate queries for each department. Grouping works on data already retrieved, while multiple queries multiply API calls.
Minimize dynamic fields and expressions: Formula fields and complex expressions in Crystal Reports execute for every row displayed. Heavy use of complex formulas can slow report rendering. If you have a complex calculation, consider whether it could be handled in the Generic Inquiry instead.
Optimize fonts and formatting: While formatting has minimal impact on generation time, it does affect preview rendering. Simpler formatting renders slightly faster than complex styling with many conditional formats.
Benchmarking and Identifying Slow Points
To optimize effectively, you need to know where time is being spent.
Measure baseline performance: Run your report and note the time it takes. Then make one optimization—add a parameter to filter data, for example—and measure again. You’ll immediately see which optimization provides the biggest benefit.
Test with production-like data volume: Development environments often have weeks or months of sample data, while production might have years of transactions. Test report performance against a data volume similar to production to identify real-world bottlenecks.
Monitor Acumatica server load: During report generation, check your Acumatica server’s CPU and memory usage. If server resources are maxed out, infrastructure investment or load distribution across Processing Nodes may be needed alongside query optimization.
When to Split One Report Into Multiple Reports
As datasets grow, you might reach a point where a single comprehensive report becomes impractical. A report attempting to show all transactions across all companies for all years might be too ambitious.
Consider splitting it:
- Instead of “All Transactions,” create “Current Month Transactions,” “YTD Transactions,” and “Annual Transactions”
- Rather than “All Customers,” create “Active Customers,” “Inactive Customers,” and “New Customers”
- Break consolidation reports into subsidiary reports rather than one master report
This approach provides users more focused, faster reports while respecting Acumatica’s performance constraints.
Key Takeaway: Report performance issues in AstraReports stem from data retrieval inefficiency, not tool limitations. Use parameters to filter data before load for the biggest immediate benefit. Optimize Generic Inquiry design by selecting only necessary fields, minimizing joins, and using efficient WHERE clauses. Test incrementally as you scale data volume, and adjust Acumatica infrastructure if needed. With strategic optimization, AstraReports handles large datasets efficiently.
Step-by-Step: Running Reports That Include Sub-Reports
Sub-reports are the right answer when one report needs to embed a second, independently-filtered query—think a customer statement that lists open invoices alongside their associated credit memos, or a project summary that shows tasks plus their time entries. AstraReports treats sub-reports as first-class citizens: you build them the same way you build any other Crystal Report, then attach them to a parent.
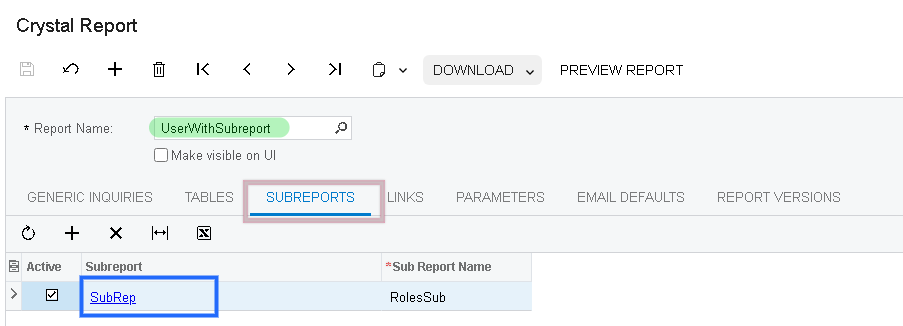
1. Pick the Parent Report
Open the report that contains the sub-report.
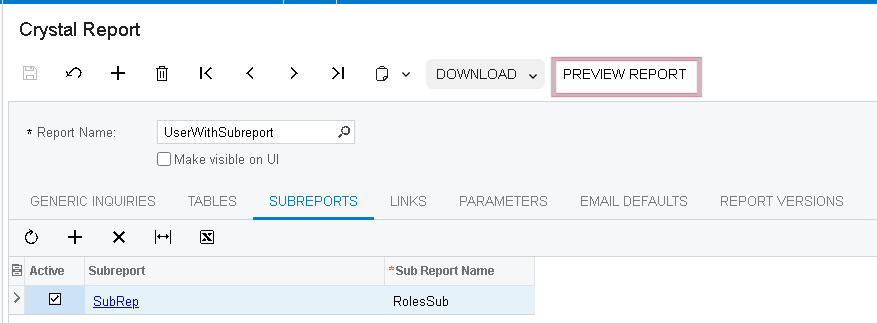
2. Click Preview Report
The Preview button runs the parent and its embedded sub-reports in a single pass.
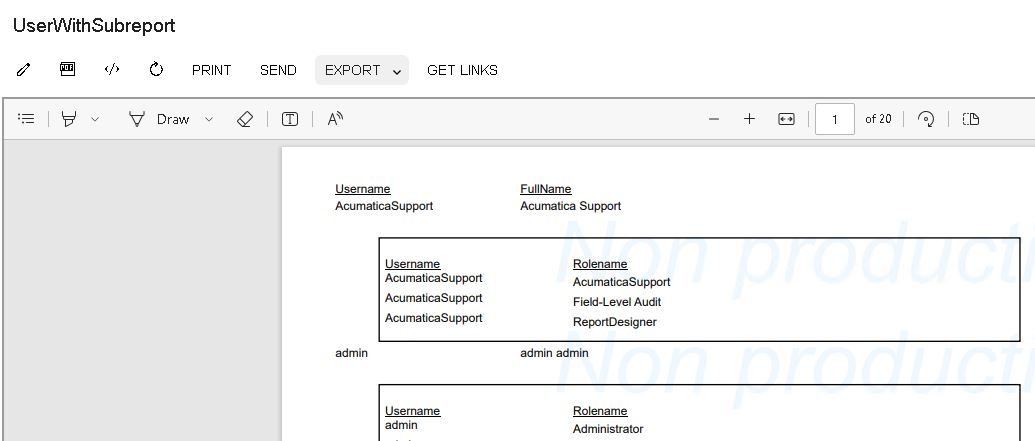
3. Verify the Output
The preview renders the parent report’s main band followed by the sub-report contents inline. Both share the same parameter context, so filtering the parent automatically filters the sub-report.
Performance Considerations Specific to Sub-Reports
Sub-reports are extremely useful but they multiply the work the Report Server does, because every record in the parent triggers a fresh query for the sub-report. Two rules of thumb:
- Cap the parent’s rowcount with a parameter. A statement that lists all customers will fire the sub-report once per customer—great for 50 customers, painful for 5,000. Add a date or customer-range parameter so the parent is always bounded.
- Avoid sub-reports inside group footers. Crystal Reports re-runs sub-reports for every group; nesting them inside a group footer can multiply queries by an order of magnitude. Move the logic into the main report when you can.
When in doubt, run the parent without the sub-report first, look at the timing, then add the sub-report and compare. The delta tells you whether the sub-report needs its own optimization pass.